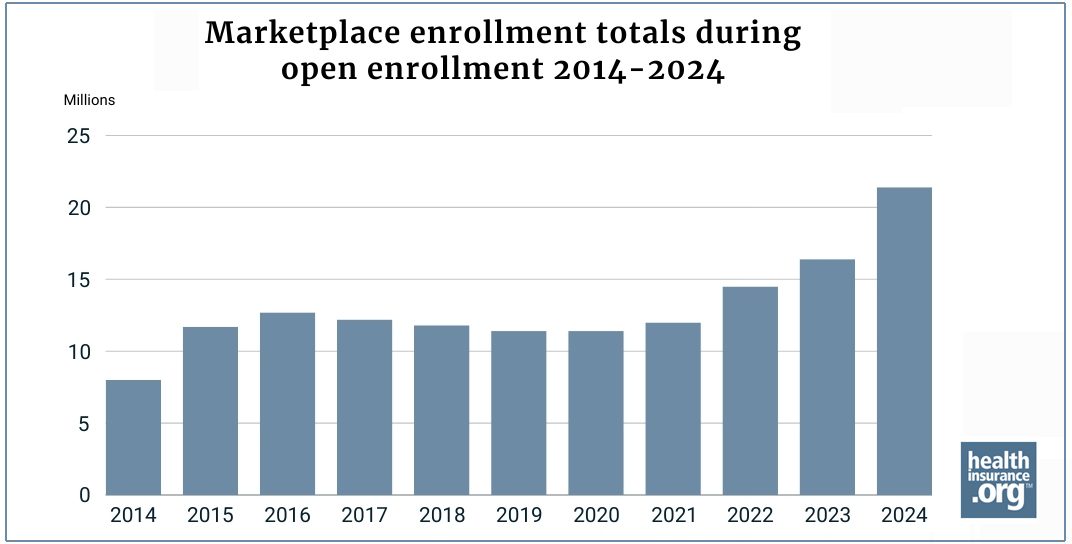
During the open enrollment period for 2024 health coverage, more than 21.4 million people enrolled in private qualified health plans (QHPs) through the Marketplaces (exchanges) nationwide. This was a 31% increase over the previous record high set in 2023, when 16.4 million people enrolled in Marketplace QHPs.
In addition to the 21.4 million QHP enrollments, another 1.3 million people enrolled in the Basic Health Program (BHP) coverage offered via the Marketplaces in New York and Minnesota, for a total of more than 22.7 million enrollees.
There are a variety of factors that could be driving the increased enrollment in 2024, including the “unwinding” of the pandemic-era Medicaid continuous coverage rule, the continued enhancement of ACA premium subsidies under the American Rescue Plan and Inflation Reduction Act, as well as state-specific factors.
Medicaid unwinding
One significant reason for the 2024 enrollment growth is the Medicaid disenrollments that resumed in 2023 after being paused for three years during the pandemic. States could resume disenrollments as early as April 2023, and all states have been working to redetermine eligibility for everyone enrolled in Medicaid.
As of April 19, 2024, more than 20.3 million people had been disenrolled from Medicaid/CHIP. Some of these people have transitioned to employer-sponsored coverage or reenrolled in Medicaid or CHIP. However, some have enrolled in replacement coverage through the Marketplaces.
According to CMS data (for HealthCare.gov and here for state-based Marketplaces), more than 3.4 million people who had Medicaid/CHIP in March 2023 or a more recent month had enrolled in Marketplace QHPs by the end of December, along with more than 257,000 who had enrolled in BHP coverage.
The approximately 3.4 million “unwinding” QHP enrollees account for about two-thirds of the approximately 5.1 million additional Marketplace enrollments for 2024 versus 2023. (To clarify, it’s unlikely that everyone who transitioned from Medicaid to the Marketplace in 2023 kept their Marketplace coverage for 2024, so we can’t say that all approximately 3.4 million of the “unwinding” QHP enrollees are among the additional approximately 5.1 million QHP enrollees for 2024. However, the Medicaid unwinding is widely regarded as a primary driver of the enrollment increase in 2024).
A significant portion of the enrollment growth in 2024 was among lower-income enrollees, some of whom may have been among those disenrolled from Medicaid due to an income that increased above the Medicaid eligibility limits. For applicants with household incomes between 100% and 150% of the poverty level, enrollment was more than 54% higher in 2024 than it had been for 2023 Marketplace plans.
On the higher end of the income spectrum, enrollment was about 9% higher in 2024 than it had been in 2023 for enrollees with household income above 400% of the poverty level. (Details of enrollment by income ranges can be seen in the state-level public use files for 2023 and 2024.)
Continued enhancement of ACA subsidies
Not only is current Marketplace enrollment at a record high, but Marketplace enrollment has grown each year since 2021. This has largely been due to the subsidy enhancements created by the American Rescue Plan (ARP), which were extended through 2025 by the Inflation Reduction Act (IRA).
For 2024 coverage, 19.7 million QHP enrollees – 92% of the approximately 21.4 million total – are receiving advance premium tax credits (APTC). The average full-price Marketplace premium is $605, but the average after-APTC premium – even accounting for the 8% of enrollees who pay full price – is just $111/month. And nearly 9.4 million enrollees are paying no more than $10/month for their coverage, after APTC is applied.
Although the subsidy enhancements took effect in 2021, utilization of them has been steadily growing since then, helping to drive enrollment higher each year.
Future of subsidy enhancements uncertain
The subsidy enhancements will continue for 2025 health plans, but it will require a literal act of Congress to extend them past the end of 2025. (To clarify, the basic ACA premium subsidies will continue indefinitely; it’s only the ARP/IRA subsidy enhancements that are scheduled to sunset at the end of 2025.)
The Congressional Budget Office has projected that Marketplace enrollments would drop by about 3.2 million people in 2026 (compared to projected 2025 enrollment) if the APR subsidy enhancements are allowed to expire.
President Biden has called on Congress to make the ARP’s subsidy enhancements permanent. But there is political division on this issue, and the Republican Study Committee’s recently published budget proposal calls for the ARP/IRA enhancements of premium tax credits to end.
So while we can’t say what the future holds, we do know that Marketplace enrollment has reached an all-time high in 2024, driven largely by improved affordability as well as Medicaid disenrollments. And although open enrollment for 2024 coverage has ended everywhere except New York, consumers in every state can still enroll if they’re eligible for a special enrollment period.
State-by-state details
All but one state – and Washington, D.C. – saw year-over-year Marketplace QHP enrollment growth from 2023 to 2024. Maine was the only exception, with a 1.3% decrease in enrollment. Maine has clarified that this was due to an increase in the income limits for Medicaid eligibility for children and young adults, some of whom were able to transition from Marketplace plans to Medicaid starting in late 2023.
Washington DC’s year-over-year enrollment growth was only 0.2%, and six states – Alaska, California, Hawaii, Nevada, Oregon, and Wyoming – had enrollment growth under 10%.
But the rest of the country saw double-digit enrollment growth, including a staggering 80.2% increase in enrollment in West Virginia’s Marketplace, and six other states where the year-over-year enrollment growth exceeded 50%: Arkansas, Indiana, Louisiana, Mississippi, Ohio, and Tennessee.
Why enrollment in West Virginia spiked
According to West Virginia’s Office of the Insurance Commissioner, the sharp increase in enrollment this year was due to a combination of the ongoing ARP/IRA federal subsidy enhancements and the Medicaid unwinding – both discussed above – along with increased outreach and education on the part of insurance carriers and enrollment assisters. This included the first annual Cover West Virginia Day that was held in early January.
But it’s also worth noting that there were some changes in pricing dynamics in West Virginia that might have had an impact. The state confirmed that the carriers continue to set their own CSR-defunding load, as opposed to states like Texas and New Mexico, where state regulators set them.
(CSR-defunding load refers to the fact that the federal government stopped reimbursing insurers for the cost of cost-sharing reductions in late 2017, and carriers have been adding the cost to premiums since then. In most cases, the cost is added to Silver-level plans, which increases Silver plan prices and thus also increases premium tax credit amounts, which are based on the premium of the second-lowest-cost Silver plan.)
However, a 50-year-old in Charleston, WV, earning $40,000 in 2024 can get a Gold plan for as little as $124/month after subsidies, as opposed to the lowest-cost Silver plan which is $151/month. In other words, low-cost Silver plans are priced higher than low-cost Gold plans.
This drives up subsidy amounts – which are based on the price of the second-lowest-cost Silver plan – and results in Gold coverage being relatively more affordable. In 2023, that was not the case. The lowest-cost Gold plan was $208/month for a 50-year-old Charleston, WV resident earning $40,000, while the lowest-cost Silver plan was $190/month.
These pricing changes that ultimately made coverage more affordable — combined with Medicaid unwinding and the increased Marketplace outreach activities — resulted in a sharp increase in the number of West Virginia residents enrolled in Marketplace plans.
How and why premiums vary from state to state
Pricing dynamics vary from one state to another. This includes how the available plans in a given area stack up against each other in price and CSR defunding loads. The bigger the pricing difference between the benchmark plan (second-lowest-cost Silver plan) and less-expensive plans, the more affordable those lower-priced plans will be after the subsidy is applied. And higher CSR defunding loads mean higher prices for Silver plans and thus larger premium subsidies.
There are also state variations in income, access to Medicaid, government support for the Marketplace, etc. Several states also offer additional state-funded subsidies, some of which are newly available or expanded as of 2024. With all that in mind, here’s a state-by-state summary of some of the data from the 2024 open enrollment period:
Open enrollment data highlights by state
Alabama
- 386,195 – 2024 QHP enrollment total in Alabama
- 258,327 – 2023 QHP enrollment total in Alabama
- 5% increase – Percentage year-over-year change in total QHP enrollment
- 68,833 – Number of residents who transitioned from Medicaid to a QHP by December 2023
- $656 – Average 2024 APTC (advance premium tax credit) per QHP enrollee
- 96% – Percentage of 2024 Marketplace enrollees who were determined eligible for APTC
Alaska
- 27,464 – 2024 QHP enrollment total in Alaska
- 25,572 – 2023 QHP enrollment total in Alaska
- 4% increase – Percentage year-over-year change in total QHP enrollment
- 5,588 – Number of residents who transitioned from Medicaid to a QHP by December 2023
- $865 – Average 2024 APTC (advance premium tax credit) per QHP enrollee
- 85% – Percentage of 2024 Marketplace enrollees who were determined eligible for APTC
Arizona
- 348,055 – 2024 QHP enrollment total in Arizona
- 235,229 – 2023 QHP enrollment total in Arizona
- 96% increase – Percentage year-over-year change in total QHP enrollment
- 97,944 – Number of residents who transitioned from Medicaid to a QHP by December 2023
- $452 – Average 2024 APTC (advance premium tax credit) per QHP enrollee
- 89% – Percentage of 2024 Marketplace enrollees who were determined eligible for APTC
Arkansas
- 156,607 – 2024 QHP enrollment total in Arkansas
- 100,407 – 2023 QHP enrollment total in Arkansas
- 97% increase – Percentage year-over-year change in total QHP enrollment
- 54,953 – Number of residents who transitioned from Medicaid to a QHP by December 2023
- $476 – Average 2024 APTC (advance premium tax credit) per QHP enrollee
- 92% – Percentage of 2024 Marketplace enrollees who were determined eligible for APTC
California
- 1,784,653 – 2024 QHP enrollment total in California
- 1,739,368 – 2023 QHP enrollment total in California
- 60% increase – Percentage year-over-year change in total QHP enrollment
- 105,758 – Number of residents who transitioned from Medicaid to a QHP by December 2023
- $526.00 – Average 2024 APTC (advance premium tax credit) per QHP enrollee
Colorado
- 237,106 – 2024 QHP enrollment total in Colorado
- 201,758 – 2023 QHP enrollment total in Colorado
- 52% increase – Percentage year-over-year change in total QHP enrollment
- 12,108 – Number of residents who transitioned from Medicaid to a QHP by December 2023
- $455 – Average 2024 APTC (advance premium tax credit) per QHP enrollee
Connecticut
- 129,000 – 2024 QHP enrollment total in Connecticut
- 108,132 – 2023 QHP enrollment total in Connecticut
- 30% increase – Percentage year-over-year change in total QHP enrollment
- 12,568 – Number of residents who transitioned from Medicaid to a QHP by December 2023
- $766 – Average 2024 APTC (advance premium tax credit) per QHP enrollee
- 87% – Percentage of 2024 Marketplace enrollees who were determined eligible for APTC
Delaware
- 44,842 – 2024 QHP enrollment total in Delaware
- 34,742 – 2023 QHP enrollment total in Delaware
- 07% increase – Percentage year-over-year change in total QHP enrollment
- 10,358 – Number of residents who transitioned from Medicaid to a QHP by December 2023
- $585 – Average 2024 APTC (advance premium tax credit) per QHP enrollee
- 90% – Percentage of 2024 Marketplace enrollees who were determined eligible for APTC
District of Columbia
- 14,799 – 2024 QHP enrollment total in District of Columbia
- 14,768 – 2023 QHP enrollment total in District of Columbia
- 21% increase – Percentage year-over-year change in total QHP enrollment
- 39 – Number of residents who transitioned from Medicaid to a QHP by December 2023
- $561 – Average 2024 APTC (advance premium tax credit) per QHP enrollee
- 21% – Percentage of 2024 Marketplace enrollees who were determined eligible for APTC
Florida
- 4,211,902 – 2024 QHP enrollment total in Florida
- 3,225,435 – 2023 QHP enrollment total in Florida
- 58% increase – Percentage year-over-year change in total QHP enrollment
- 565,925 – Number of residents who transitioned from Medicaid to a QHP by December 2023
- $568 – Average 2024 APTC (advance premium tax credit) per QHP enrollee
- 97% – Percentage of 2024 Marketplace enrollees who were determined eligible for APTC
Georgia
- 1,305,114 – 2024 QHP enrollment total in Georgia
- 879,084 – 2023 QHP enrollment total in Georgia
- 46% increase – Percentage year-over-year change in total QHP enrollment
- 196,448 – Number of residents who transitioned from Medicaid to a QHP by December 2023
- $531 – Average 2024 APTC (advance premium tax credit) per QHP enrollee
- 96% – Percentage of 2024 Marketplace enrollees who were determined eligible for APTC
Hawaii
- 22,170 – 2024 QHP enrollment total in Hawaii
- 21,645 – 2023 QHP enrollment total in Hawaii
- 43% increase – Percentage year-over-year change in total QHP enrollment
- 4,085 – Number of residents who transitioned from Medicaid to a QHP by December 2023
- $544 – Average 2024 APTC (advance premium tax credit) per QHP enrollee
- 82% – Percentage of 2024 Marketplace enrollees who were determined eligible for APTC
Idaho
- 103,783 – 2024 QHP enrollment total in Idaho
- 79,927 – 2023 QHP enrollment total in Idaho
- 85% increase – Percentage year-over-year change in total QHP enrollment
- 13,671 – Number of residents who transitioned from Medicaid to a QHP by December 2023
- $395 – Average 2024 APTC (advance premium tax credit) per QHP enrollee
- 86% – Percentage of 2024 Marketplace enrollees who were determined eligible for APTC
Illinois
- 398,814 – 2024 QHP enrollment total in Illinois
- 342,995 – 2023 QHP enrollment total in Illinois
- 27% increase – Percentage year-over-year change in total QHP enrollment
- 75,718 – Number of residents who transitioned from Medicaid to a QHP by December 2023
- $545 – Average 2024 APTC (advance premium tax credit) per QHP enrollee
- 89% – Percentage of 2024 Marketplace enrollees who were determined eligible for APTC
Indiana
- 295,772 – 2024 QHP enrollment total in Indiana
- 185,354 – 2023 QHP enrollment total in Indiana
- 57% increase – Percentage year-over-year change in total QHP enrollment
- 91,553 – Number of residents who transitioned from Medicaid to a QHP by December 2023
- $452 – Average 2024 APTC (advance premium tax credit) per QHP enrollee
- 89% – Percentage of 2024 Marketplace enrollees who were determined eligible for APTC
Iowa
- 111,423 – 2024 QHP enrollment total in Iowa
- 82,704 – 2023 QHP enrollment total in Iowa
- 73% increase – Percentage year-over-year change in total QHP enrollment
- 28,596 – Number of residents who transitioned from Medicaid to a QHP by December 2023
- $507 – Average 2024 APTC (advance premium tax credit) per QHP enrollee
- 89% – Percentage of 2024 Marketplace enrollees who were determined eligible for APTC
Kansas
- 171,376 – 2024 QHP enrollment total in Kansas
- 124,473 – 2023 QHP enrollment total in Kansas
- 68% increase – Percentage year-over-year change in total QHP enrollment
- 22,561 – Number of residents who transitioned from Medicaid to a QHP by December 2023
- $561 – Average 2024 APTC (advance premium tax credit) per QHP enrollee
- 93% – Percentage of 2024 Marketplace enrollees who were determined eligible for APTC
Kentucky
- 75,317 – 2024 QHP enrollment total in Kentucky
- 62,562 – 2023 QHP enrollment total in Kentucky
- 39% increase – Percentage year-over-year change in total QHP enrollment
- 13,375 – Number of residents who transitioned from Medicaid to a QHP by December 2023
- $497 – Average 2024 APTC (advance premium tax credit) per QHP enrollee
- 83% – Percentage of 2024 Marketplace enrollees who were determined eligible for APTC
Louisiana
- 212,493 – 2024 QHP enrollment total in Louisiana
- 120,804 – 2023 QHP enrollment total in Louisiana
- 90% increase – Percentage year-over-year change in total QHP enrollment
- 73,770 – Number of residents who transitioned from Medicaid to a QHP by December 2023
- $647 – Average 2024 APTC (advance premium tax credit) per QHP enrollee
- 96% – Percentage of 2024 Marketplace enrollees who were determined eligible for APTC
Maine
- 62,586 – 2024 QHP enrollment total in Maine
- 63,388 – 2023 QHP enrollment total in Maine
- 27% decrease – Percentage year-over-year change in total QHP enrollment
- 1,052 – Number of residents who transitioned from Medicaid to a QHP by December 2023
- $564 – Average 2024 APTC (advance premium tax credit) per QHP enrollee
- 84% – Percentage of 2024 Marketplace enrollees who were determined eligible for APTC
Maryland
- 213,895 – 2024 QHP enrollment total in Maryland
- 182,166 – 2023 QHP enrollment total in Maryland
- 42% increase – Percentage year-over-year change in total QHP enrollment
- 43,034 – Number of residents who transitioned from Medicaid to a QHP by December 2023
- $388 – Average 2024 APTC (advance premium tax credit) per QHP enrollee
- 77% – Percentage of 2024 Marketplace enrollees who were determined eligible for APTC
Massachusetts
- 311,199 – 2024 QHP enrollment total in Massachusetts
- 232,621 – 2023 QHP enrollment total in Massachusetts
- 78% increase – Percentage year-over-year change in total QHP enrollment
- 63,815 – Number of residents who transitioned from Medicaid to a QHP by December 2023
- $385 – Average 2024 APTC (advance premium tax credit) per QHP enrollee
- 80% – Percentage of 2024 Marketplace enrollees who were determined eligible for APTC
Michigan
- 418,100 – 2024 QHP enrollment total in Michigan
- 322,273 – 2023 QHP enrollment total in Michigan
- 73% increase – Percentage year-over-year change in total QHP enrollment
- 106,503 – Number of residents who transitioned from Medicaid to a QHP by December 2023
- $426 – Average 2024 APTC (advance premium tax credit) per QHP enrollee
- 89% – Percentage of 2024 Marketplace enrollees who were determined eligible for APTC
Minnesota
- 135,001 – 2024 QHP enrollment total in Minnesota
- 118,431 – 2023 QHP enrollment total in Minnesota
- 99% increase – Percentage year-over-year change in total QHP enrollment
- 9,748 – Number of residents who transitioned from Medicaid to a QHP by December 2023
- $351 – Average 2024 APTC (advance premium tax credit) per QHP enrollee
- 58% – Percentage of 2024 Marketplace enrollees who were determined eligible for APTC
Mississippi
- 286,410 – 2024 QHP enrollment total in Mississippi
- 183,478 – 2023 QHP enrollment total in Mississippi
- 10% increase – Percentage year-over-year change in total QHP enrollment
- 52,760 – Number of residents who transitioned from Medicaid to a QHP by December 2023
- $592 – Average 2024 APTC (advance premium tax credit) per QHP enrollee
- 98% – Percentage of 2024 Marketplace enrollees who were determined eligible for APTC
Missouri
- 359,369 – 2024 QHP enrollment total in Missouri
- 257,629 – 2023 QHP enrollment total in Missouri
- 49% increase – Percentage year-over-year change in total QHP enrollment
- 92,356 – Number of residents who transitioned from Medicaid to a QHP by December 2023
- $594 – Average 2024 APTC (advance premium tax credit) per QHP enrollee
- 94% – Percentage of 2024 Marketplace enrollees who were determined eligible for APTC
Montana
- 66,336 – 2024 QHP enrollment total in Montana
- 53,860 – 2023 QHP enrollment total in Montana
- 16% increase – Percentage year-over-year change in total QHP enrollment
- 15,973 – Number of residents who transitioned from Medicaid to a QHP by December 2023
- $504 – Average 2024 APTC (advance premium tax credit) per QHP enrollee
- 88% – Percentage of 2024 Marketplace enrollees who were determined eligible for APTC
Nebraska
- 117,882 – 2024 QHP enrollment total in Nebraska
- 101,490 – 2023 QHP enrollment total in Nebraska
- 15% increase – Percentage year-over-year change in total QHP enrollment
- 16,820 – Number of residents who transitioned from Medicaid to a QHP by December 2023
- $580 – Average 2024 APTC (advance premium tax credit) per QHP enrollee
- 95% – Percentage of 2024 Marketplace enrollees who were determined eligible for APTC
Nevada
- 99,312 – 2024 QHP enrollment total in Nevada
- 96,379 – 2023 QHP enrollment total in Nevada
- 04% increase – Percentage year-over-year change in total QHP enrollment
- 3,872 – Number of residents who transitioned from Medicaid to a QHP by December 2023
- $438 – Average 2024 APTC (advance premium tax credit) per QHP enrollee
- 86% – Percentage of 2024 Marketplace enrollees who were determined eligible for APTC
New Hampshire
- 65,117 – 2024 QHP enrollment total in New Hampshire
- 54,557 – 2023 QHP enrollment total in New Hampshire
- 36% increase – Percentage year-over-year change in total QHP enrollment
- 16,969 – Number of residents who transitioned from Medicaid to a QHP by December 2023
- $350 – Average 2024 APTC (advance premium tax credit) per QHP enrollee
- 72% – Percentage of 2024 Marketplace enrollees who were determined eligible for APTC
New Jersey
- 397,942 – 2024 QHP enrollment total in New Jersey
- 341,901 – 2023 QHP enrollment total in New Jersey
- 39% increase – Percentage year-over-year change in total QHP enrollment
- 24,739 – Number of residents who transitioned from Medicaid to a QHP by December 2023
- $521 – Average 2024 APTC (advance premium tax credit) per QHP enrollee
- 88% – Percentage of 2024 Marketplace enrollees who were determined eligible for APTC
New Mexico
- 56,472 – 2024 QHP enrollment total in New Mexico
- 40,778 – 2023 QHP enrollment total in New Mexico
- 49% increase – Percentage year-over-year change in total QHP enrollment
- 3,851 – Number of residents who transitioned from Medicaid to a QHP by December 2023
- $551 – Average 2024 APTC (advance premium tax credit) per QHP enrollee
- 82% – Percentage of 2024 Marketplace enrollees who were determined eligible for APTC
New York
- 288,681 – 2024 QHP enrollment total in New York
- 214,052 – 2023 QHP enrollment total in New York
- 86% increase – Percentage year-over-year change in total QHP enrollment
- 59,849 – Number of residents who transitioned from Medicaid to a QHP by December 2023
- $455 – Average 2024 APTC (advance premium tax credit) per QHP enrollee
- 71% – Percentage of 2024 Marketplace enrollees who were determined eligible for APTC
North Carolina
- 1,027,930 – 2024 QHP enrollment total in North Carolina
- 800,850 – 2023 QHP enrollment total in North Carolina
- 35% increase – Percentage year-over-year change in total QHP enrollment
- 231,141 – Number of residents who transitioned from Medicaid to a QHP by December 2023
- $558 – Average 2024 APTC (advance premium tax credit) per QHP enrollee
- 95% – Percentage of 2024 Marketplace enrollees who were determined eligible for APTC
North Dakota
- 38,535 – 2024 QHP enrollment total in North Dakota
- 34,130 – 2023 QHP enrollment total in North Dakota
- 91% increase – Percentage year-over-year change in total QHP enrollment
- 4,310 – Number of residents who transitioned from Medicaid to a QHP by December 2023
- $433 – Average 2024 APTC (advance premium tax credit) per QHP enrollee
- 90% – Percentage of 2024 Marketplace enrollees who were determined eligible for APTC
Ohio
- 477,793 – 2024 QHP enrollment total in Ohio
- 294,644 – 2023 QHP enrollment total in Ohio
- 16% increase – Percentage year-over-year change in total QHP enrollment
- 131,800 – Number of residents who transitioned from Medicaid to a QHP by December 2023
- $498 – Average 2024 APTC (advance premium tax credit) per QHP enrollee
- 89% – Percentage of 2024 Marketplace enrollees who were determined eligible for APTC
Oklahoma
- 277,436 – 2024 QHP enrollment total in Oklahoma
- 203,157 – 2023 QHP enrollment total in Oklahoma
- 56% increase – Percentage year-over-year change in total QHP enrollment
- 88,656 – Number of residents who transitioned from Medicaid to a QHP by December 2023
- $575 – Average 2024 APTC (advance premium tax credit) per QHP enrollee
- 96% – Percentage of 2024 Marketplace enrollees who were determined eligible for APTC
Oregon
- 145,509 – 2024 QHP enrollment total in Oregon
- 141,963 – 2023 QHP enrollment total in Oregon
- 50% increase – Percentage year-over-year change in total QHP enrollment
- 25,869 – Number of residents who transitioned from Medicaid to a QHP by December 2023
- $524 – Average 2024 APTC (advance premium tax credit) per QHP enrollee
- 81% – Percentage of 2024 Marketplace enrollees who were determined eligible for APTC
Pennsylvania
- 434,571 – 2024 QHP enrollment total in Pennsylvania
- 371,516 – 2023 QHP enrollment total in Pennsylvania
- 97% increase – Percentage year-over-year change in total QHP enrollment
- 57,547 – Number of residents who transitioned from Medicaid to a QHP by December 2023
- $530 – Average 2024 APTC (advance premium tax credit) per QHP enrollee
- 87% – Percentage of 2024 Marketplace enrollees who were determined eligible for APTC
Rhode Island
- 36,121 – 2024 QHP enrollment total in Rhode Island
- 29,626 – 2023 QHP enrollment total in Rhode Island
- 92% increase – Percentage year-over-year change in total QHP enrollment
- 2,260 – Number of residents who transitioned from Medicaid to a QHP by December 2023
- $454 – Average 2024 APTC (advance premium tax credit) per QHP enrollee
- 86% – Percentage of 2024 Marketplace enrollees who were determined eligible for APTC
South Carolina
- 571,175 – 2024 QHP enrollment total in South Carolina
- 382,968 – 2023 QHP enrollment total in South Carolina
- 14% increase – Percentage year-over-year change in total QHP enrollment
- 143,780 – Number of residents who transitioned from Medicaid to a QHP by December 2023
- $553 – Average 2024 APTC (advance premium tax credit) per QHP enrollee
- 96% – Percentage of 2024 Marketplace enrollees who were determined eligible for APTC
South Dakota
- 52,974 – 2024 QHP enrollment total in South Dakota
- 47,591 – 2023 QHP enrollment total in South Dakota
- 31% increase – Percentage year-over-year change in total QHP enrollment
- 6,624 – Number of residents who transitioned from Medicaid to a QHP by December 2023
- $611 – Average 2024 APTC (advance premium tax credit) per QHP enrollee
- 95% – Percentage of 2024 Marketplace enrollees who were determined eligible for APTC
Tennessee
- 555,103 – 2024 QHP enrollment total in Tennessee
- 348,097 – 2023 QHP enrollment total in Tennessee
- 47% increase – Percentage year-over-year change in total QHP enrollment
- 87,967 – Number of residents who transitioned from Medicaid to a QHP by December 2023
- $580 – Average 2024 APTC (advance premium tax credit) per QHP enrollee
- 95% – Percentage of 2024 Marketplace enrollees who were determined eligible for APTC
Texas
- 3,484,632 – 2024 QHP enrollment total in Texas
- 2,410,810 – 2023 QHP enrollment total in Texas
- 54% increase – Percentage year-over-year change in total QHP enrollment
- 481,099 – Number of residents who transitioned from Medicaid to a QHP by December 2023
- $536 – Average 2024 APTC (advance premium tax credit) per QHP enrollee
- 96% – Percentage of 2024 Marketplace enrollees who were determined eligible for APTC
Utah
- 366,939 – 2024 QHP enrollment total in Utah
- 295,196 – 2023 QHP enrollment total in Utah
- 30% increase – Percentage year-over-year change in total QHP enrollment
- 42,419 – Number of residents who transitioned from Medicaid to a QHP by December 2023
- $421 – Average 2024 APTC (advance premium tax credit) per QHP enrollee
- 95% – Percentage of 2024 Marketplace enrollees who were determined eligible for APTC
Vermont
- 30,027 – 2024 QHP enrollment total in Vermont
- 25,664 – 2023 QHP enrollment total in Vermont
- 00% increase – Percentage year-over-year change in total QHP enrollment
- 4,050 – Number of residents who transitioned from Medicaid to a QHP by December 2023
- $702 – Average 2024 APTC (advance premium tax credit) per QHP enrollee
- 89% – Percentage of 2024 Marketplace enrollees who were determined eligible for APTC
Virginia
- 400,058 – 2024 QHP enrollment total in Virginia
- 346,140 – 2023 QHP enrollment total in Virginia
- 58% increase – Percentage year-over-year change in total QHP enrollment
- 22,652 – Number of residents who transitioned from Medicaid to a QHP by December 2023
- $405 – Average 2024 APTC (advance premium tax credit) per QHP enrollee
- 87% – Percentage of 2024 Marketplace enrollees who were determined eligible for APTC
Washington
West Virginia
- 51,046 – 2024 QHP enrollment total in West Virginia
- 28,325 – 2023 QHP enrollment total in West Virginia
- 22% increase – Percentage year-over-year change in total QHP enrollment
- 19,812 – Number of residents who transitioned from Medicaid to a QHP by December 2023
- $1,035 – Average 2024 APTC (advance premium tax credit) per QHP enrollee
- 97% – Percentage of 2024 Marketplace enrollees who were determined eligible for APTC
Wisconsin
- 266,327 – 2024 QHP enrollment total in Wisconsin
- 221,128 – 2023 QHP enrollment total in Wisconsin
- 44% increase – Percentage year-over-year change in total QHP enrollment
- 48,354 – Number of residents who transitioned from Medicaid to a QHP by December 2023
- $572 – Average 2024 APTC (advance premium tax credit) per QHP enrollee
- 88% – Percentage of 2024 Marketplace enrollees who were determined eligible for APTC
Wyoming
- 42,293 – 2024 QHP enrollment total in Wyoming
- 38,565 – 2023 QHP enrollment total in Wyoming
- 67% increase – Percentage year-over-year change in total QHP enrollment
- 4,264 – Number of residents who transitioned from Medicaid to a QHP by December 2023
- $863 – Average 2024 APTC (advance premium tax credit) per QHP enrollee
- 95% – Percentage of 2024 Marketplace enrollees who were determined eligible for APTC
- 2024 QHP enrollment totals – CMS.gov
- 2023 QHP enrollment totals – CMS.gov
- Number of residents who transitioned from Medicaid to a QHP by December 2023 (FFM states) – Medicaid.gov
- Number of residents who transitioned from Medicaid to a QHP by December 2023 (SBM states) – Medicaid.gov
- Average 2024 APTC – CMS.gov
- Percentage of enrollees eligible for APTC – CMS.gov
Louise Norris is an individual health insurance broker who has been writing about health insurance and health reform since 2006. She has written dozens of opinions and educational pieces about the Affordable Care Act for healthinsurance.org.
Disclaimer: This story is auto-aggregated by a computer program and has not been created or edited by healthlydays.
Publisher: Source link